Uber has released a powerful geospatial analysis application, kepler.gl.
The data visualisation took requires no coding and is already being used by AirBnB, Mapbox and Limebike. Good news for both developers and enterprises needing such a tool: it’s free and open source.
What is Kepler.gl?
According to Uber’s software engineering team: “Kepler.gl is a data-agnostic, high-performance web-based application for visual exploration of large-scale geolocation data sets”. What does this mean?
Data-agnostic
In short, simply feed kepler.gl data and it will work; no coding necessary. It processes CSV and GeoJSON files; the open standard for geospatial data formatting.
High-performance web-based application
Kepler.gl is built upon deck.gl – an Uber created web.gl data visualisation tool. This means that it can “render millions of points representing thousands of trips and perform spatial aggregations on the fly”.
However, by GPU-accelerating its layer system (layers taxonomise data into categories, such as arcs and paths) it is able to “render millions of points and making kepler.gl a much more powerful web tool than traditional cartography software”.
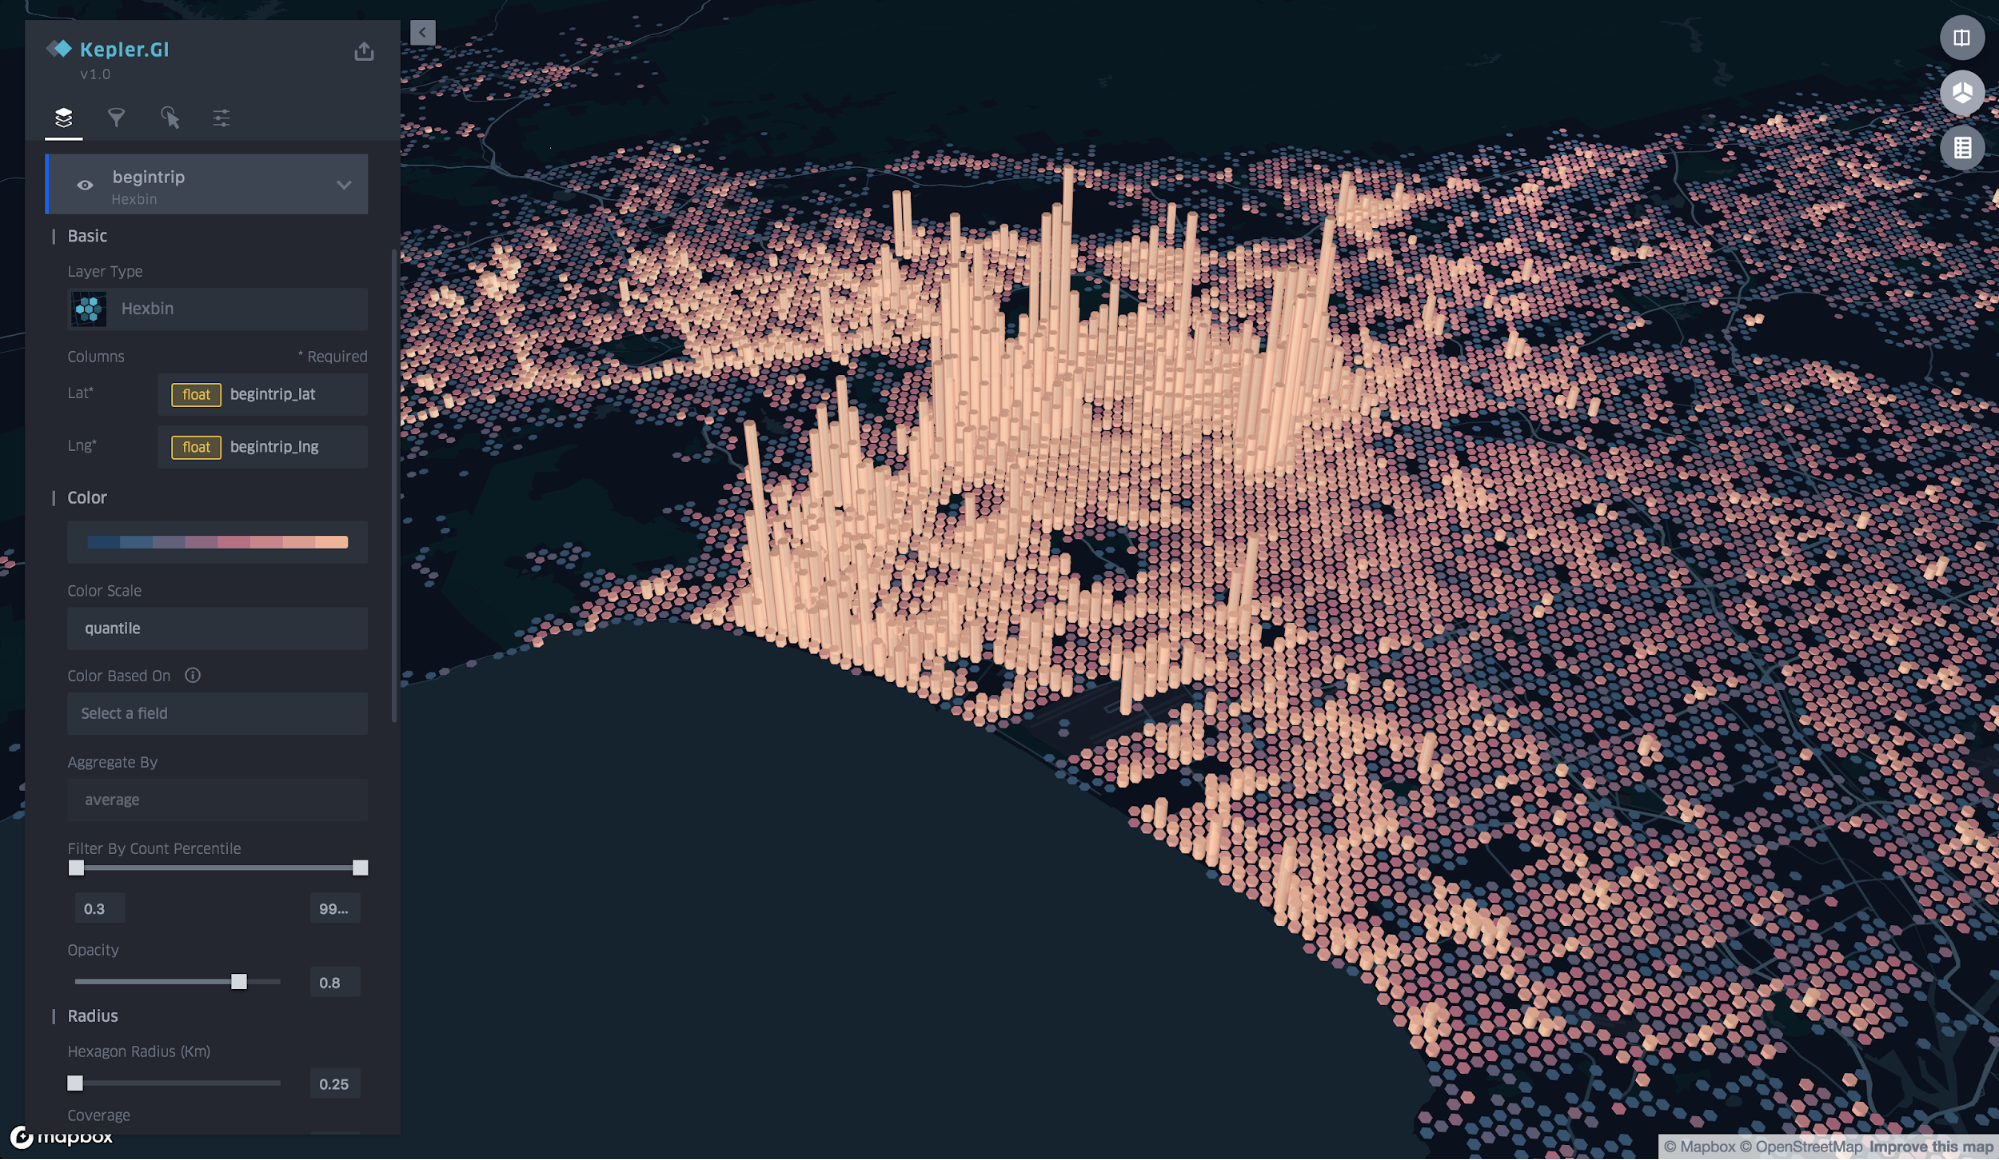
[Editor’s note: we tried this out briefly using sample data from Uber showing commute patterns in England and Wales (see below). It’s pretty nifty…]

Visual exploration of large-scale geolocation data sets
As per the main illustration accompanying this piece, users can aggregate data by averages, perform layer blending and add filters to obtain more visually contextual insights.
It’s Free and Open Source
Uber is giving to the software community by open sourcing kepler.gl. By doing this, it not only provides a cost-effective alternative to proprietary software, but also creates on-going support for the application via the open source community.
Combines Key Data into a Single Web Interface
A key issue that Uber seeks to address with the release is the current lack of interoperability in systems for collating, processing and visualising Geodata.
As Uber’s lead architect for the app, Shan He, put it in a blog: “Creating interactive visualizations follows a similar process: data collection, data processing, visualization exploration via web-based tools such as QGIS, Carto, and Mapbox Studio, and then porting the visualizations into Javascript with React, D3.js, and Three.js to build prototypes.”
She adds: “Not only is the process tedious, but it may or may not reap useful visualizations. In many cases, there are more visualization ideas than there is time and people to make them.”
Developer Friendly – Built Using React and Redux
Whatever they think of their latest Uber driver, developers are likely to receive kepler.gl with open arms, as it uses modern software paradigms and frameworks such as Redux and React (arguably the most popular user interface framework at present) respectively.
Uber’s principle design architect for the application comes from an actual architectural background. Shan He described her inspiration for the project as follows: “In architecture school, there’s this practice called parametric design where you can build 3D building models based on algorithms and parameters.”
She adds: “Rhino, a 3D modeling program, includes plugins to generate shapes using parametric design. With just a couple of lines of code, I was able to create complex structures and geometries. This experience got me interested in coding and computer science because I learned that you can actually use code to assist in the design process. This type of 3D modeling opened the door to a completely new domain for me.”
Given the application doesn’t require coding, works in the browser, requires no installation, is highly exploratory, and makes pretty useful maps.Uber’s clearly hoping Kepler.gl will do the same for others.
The company’s open source projects including Kepler.gl can be found on Uber’s Github page,