Observability is critical in a modern technology stack. Engineers need to know exactly what is happening and when, not only to allow expeditious troubleshooting but also so they can spot and act on any anomalies in production systems before they spiral into a catastrophe. As such, even with seemingly every technology product under the sun now boasting some AI capability, it’s still important to have a human in the loop to identify any problems that emerge and decide what needs to be done about them. But humans are complex, too, and it can be difficult for leaders to ensure everyone is seeing the same thing.
That was the problem facing ASAPP, a New York-based software firm which offers an AI-based messaging platform for customer contact centres. Its flagship product, ‘GenerativeAgent,’ uses generative AI to interact with end users while retaining that human in the loop to oversee multiple conversations and provide any context or answers the model cannot.
That makes for a fairly complex stack, explains ASAPP staff site reliability engineer Pato Arvizu. “You’re talking to an LLM,” says Arvizu, “but it’s speech to text, text to LLM, LLM to voice.”
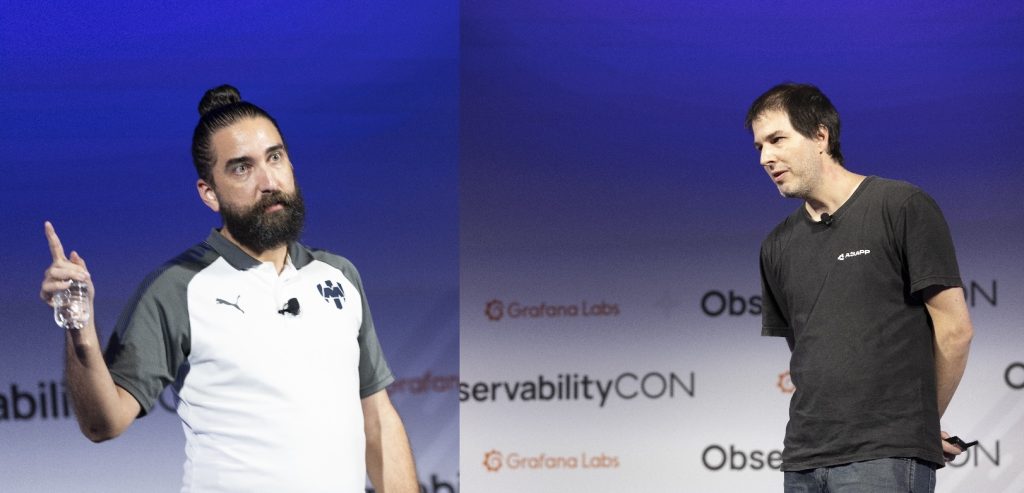
ASAPP has over 100 engineers working on its platform, split into different teams. Each group is responsible for the health of a particular service within the overall stack. “Many of the teams are on call, and they are also responsible for the metrics that they are going to track and how they are going to assess their services,” explains fellow staff site reliability engineer Ramiro de Zavalia.
The company used tools from multiple vendors to span the full range of metrics, traces and logs that had to be tracked. This included three million active time series and 60TB of traces per month. Perhaps unsurprisingly, different teams had ended up developing their own dashboards to visualise the health of the systems under their supervision. Consequently, visualising data and troubleshooting could mean switching between multiple interfaces.
The result was a technological sprawl of over 400 dashboards and alert types in the low thousands – as fine a recipe as could be found for user fatigue, onboarding chaos and troubleshooting confusion. In short, explains de Zavalia, the stack was painful for the teams “and was painful to maintain.”
Can you see what I see?
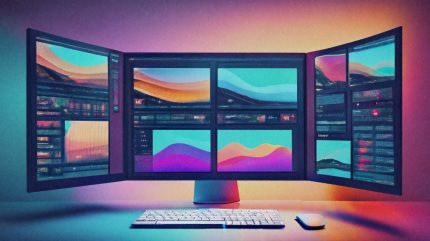
What ASAPP needed was a way of bringing order to chaos: or, put another way, a single visualisation platform that could scale, ideally from a single vendor so as to guarantee sensible levels of control and pricing. The firm had already used self-hosted instances of Grafana within its observability setup. Now it decided the analytics and visualisation specialist’s cloud-managed observability platform could support a more standardised approach and a better engineer experience, not least because it supported multiple data sources.
Freeing engineers from learning and switching between multiple tools is more than a UX benefit, explains de Zavalia. “One view with everything there,” he says, “makes correlation a lot easier.”
But the promise of an easier life is not always enough to convince every engineer. “We definitely had to sell it,” says de Zavalia, with many individuals preferring to stick with the old tools out of habit.
To get around this, ASAPP automated the migration as far as possible. The SRE team developed a CLI tool to allow individual engineering groups to carry out the migration themselves and produce a similar visual experience.
It also built its own Kubernetes controller to migrate and manage dashboards in Grafana Cloud, developing custom alerts and visualisations to make the process as self-serve as possible. This was supplemented with demos and “office hours” sessions to familiarise individual engineering teams with the new platform and the migration tools.
There were still instances of teams pining for the odd feature provided by a previous vendor. In these cases, the SRE team had to advise how to achieve the same outcome with Grafana Cloud or how to adapt to the new query language. The team was also concerned there was no clear process for creating new visualisations, so the same CLI-based tooling was used to ensure a standardised approach to dashboard creation after the migration. This ordained a “dashboards as code” workflow, which ended up keeping the dashboard in the same Git repo as application code and configuration information.
As engineers continue to create new microservices, says de Zavalia, “it’s quite easy for teams to add metrics, traces, logs, because that’s sort of abstracted on the base framework that we use.”
Despite the enhanced automation afforded by the company’s embrace of Grafana tools, the two ASAPP stalwarts still believe it’s important to keep humans in the loop. In de Zavalia’s experience, “if you make something really easy, it is because you are removing the flexibility it has.”
Arvizu adds that, while AI is here to stay, it should nonetheless be a complement to humans – and certainly to engineers. “There’s a difference,” he says, “between not wanting to Google something and asking ChatGPT, and me not understanding this feed of data and being able to be assisted in making the right decisions.”
